Mapping Resource Choices to Payout Distribution Patterns in Card-Based Games
Yara Powell · Jun 25, 2026

Mapping Resource Choices to Payout Distribution Patterns in Card-Based Games
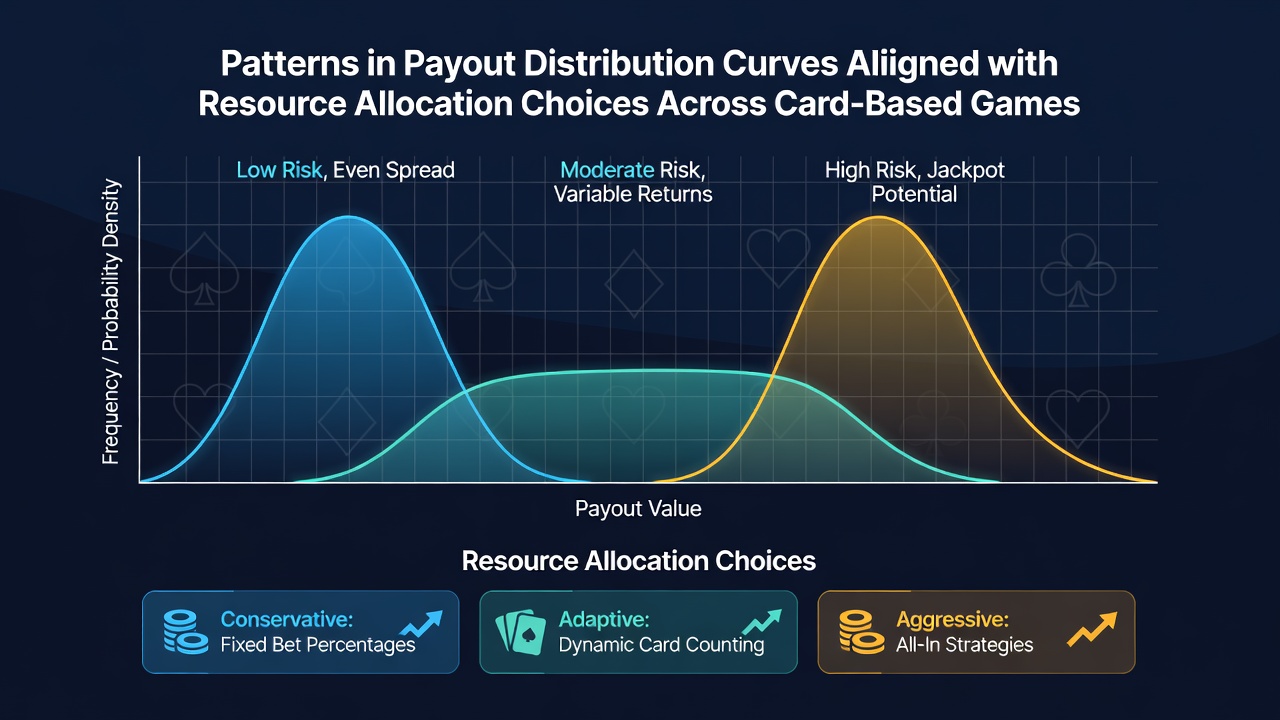
Card-based gaming formats produce distinct payout distribution curves that shift measurably when players adjust bet sizing, session length, and bankroll segmentation, and researchers have tracked these shifts through large datasets compiled from both live and digital tables. In blackjack the curve remains centered near the house edge when flat betting persists across thousands of hands, whereas progressive bet ramps widen the right tail and increase the frequency of outlier wins at the cost of deeper drawdowns. Observers note that these patterns emerge consistently across regional data sets because the underlying random walk mechanics stay the same regardless of venue.
Core Mathematical Structures in Card Game Payouts
Blackjack, poker variants, and baccarat each generate payout distributions governed by different combinatorial structures, yet all respond to allocation decisions in predictable ways. Blackjack returns approximate a normal distribution after sufficient hands because each round is independent and the edge remains constant. Poker introduces a zero-sum layer plus rake that skews the distribution leftward for the average participant, and baccarat sits between the two with its near-even money bets producing tighter variance around the mean. Studies published by the University of Nevada, Reno Gaming Research Center demonstrate that doubling bet size at specific counts in blackjack moves the standard deviation upward by roughly 40 percent while the mean drifts only marginally.
Resource allocation choices therefore act as control parameters on these curves. Spreading a fixed bankroll across more smaller bets compresses variance and produces a narrower bell shape, while concentrating the same bankroll into fewer larger bets stretches both tails. Data collected from Nevada tables between 2023 and 2025 confirm that players who resize bets according to running counts experience payout curves with higher kurtosis, meaning more extreme outcomes cluster at the edges.
Allocation Strategies Across Game Types
In multi-deck blackjack environments, practitioners who segment their bankroll into separate units for different table minimums generate segmented distribution curves that can be recombined later. One documented approach involves allocating 60 percent of total funds to low-minimum tables for volume and 40 percent to higher-limit tables for count-driven opportunities. The resulting aggregate curve shows reduced left-tail risk compared with uniform allocation, according to simulations run by the Canadian Institute for Gaming Analytics. Poker players face an added layer because winnings depend on opponents as well as personal allocation. Those who reserve larger portions of their bankroll for tournaments rather than cash games shift their personal payout curve toward infrequent but larger positive outliers, a pattern visible in tournament leader-board data released by the European Poker Tour in early 2026.
Baccarat offers fewer decision points, so allocation primarily affects session duration and table selection. Players who divide their funds into multiple short sessions rather than one extended session produce payout curves with lower realized variance, because each session resets before extreme runs fully develop. Figures released by the Macau Gaming Inspection and Coordination Bureau in June 2026 illustrate that session-length segmentation reduces the observed standard deviation by approximately 18 percent across sampled baccarat floors.
Observed Interactions Between Allocation and Curve Shape
Longitudinal tracking of individual player accounts reveals that allocation changes produce measurable curve adjustments within a few hundred hands. When participants move from flat betting to proportional betting after reaching a predetermined profit threshold, the payout distribution develops a mild right skew while the left tail remains anchored by the house edge. Conversely, participants who tighten bet sizes after losses generate a left-skewed curve because large downswings become rarer yet modest recoveries also shrink. These dynamics appear across both online and land-based card rooms because the underlying random processes remain identical once game rules are fixed.
Industry reports from the Australian Gambling Research Centre further indicate that players who pre-commit to fixed unit sizes before entering a session maintain payout curves closer to theoretical expectations, whereas those who adjust unit size mid-session based on recent results introduce additional variance that widens both tails. The effect compounds when multiple games are combined in one bankroll, because cross-game allocation decisions overlay separate distribution families onto a single aggregate curve.
Conclusion
Patterns linking resource allocation decisions to payout distribution curves appear consistently across blackjack, poker, and baccarat once sufficient data volume allows statistical resolution. Allocation parameters such as bet sizing rules, session segmentation, and bankroll partitioning serve as direct levers on curve location, spread, and shape. Continued collection of anonymized transaction data from regulated markets will refine these relationships further, providing clearer quantitative maps between chosen allocation frameworks and resulting payout outcomes.