Hot Seat Hunters Chart the Floor: Decoding Casino Layouts for Loose Video Poker Machines
Carlo Hoffmann · Apr 21, 2026

Hot Seat Hunters Chart the Floor: Decoding Casino Layouts for Loose Video Poker Machines
The Basics of Hot Seat Hunting in Video Poker
Players who dive into casino floors often turn to hot seat hunting, a methodical approach where they map out machine placements to zero in on those offering higher payback percentages; these so-called loose video poker machines return more over time compared to their tighter counterparts, and data from regulatory reports backs this up since casinos must disclose average returns by denomination and game type.
Turns out, not every video poker bank sits equal on the floor; casinos strategically cluster machines based on traffic flow, player demographics, and profit targets, so observers note how high-limit areas near entrances draw whales while low-stakes video poker hides in quieter corners yielding better odds for patient hunters.
And here's where it gets interesting: studies from gaming research centers reveal that payback percentages for video poker range from 85% to 99% depending on the variant like Jacks or Better or Deuces Wild, but loose machines—those pushing 97% or higher—cluster predictably if players bother to sketch the layout.
Why Casino Floor Layouts Hold the Key
Casinos design floors like mazes on purpose, funneling foot traffic past high-house-edge slots before reaching video poker rows; experts who've analyzed thousands of floors, such as those documented by the Nevada Gaming Control Board, point out how end-cap machines near aisles snag impulse plays whereas buried banks in the back often run looser to lure long-term session players.
People familiar with the beat know casinos rotate machines seasonally or after big events, so what hummed hot in January might tighten up by summer, but consistent mappers track these shifts using simple tools like phone apps or paper sketches marked with session results, royal flushes per hour, and average returns observed over hundreds of hands.
Take one group of dedicated trackers who charted a Las Vegas property over six months; their logs showed a 2.5% payback edge on Deuces Wild machines tucked near the buffet entrance compared to front-row units, a pattern that repeated across similar floors because operators prioritize visibility for promotional games while reserving steady payers for low-visibility spots.
What's significant here involves player traffic data, which indicates quieter zones like upper levels or near restrooms host looser settings since casinos bank on boredom turning into longer plays rather than quick hits.
Step-by-Step Mapping Techniques That Work
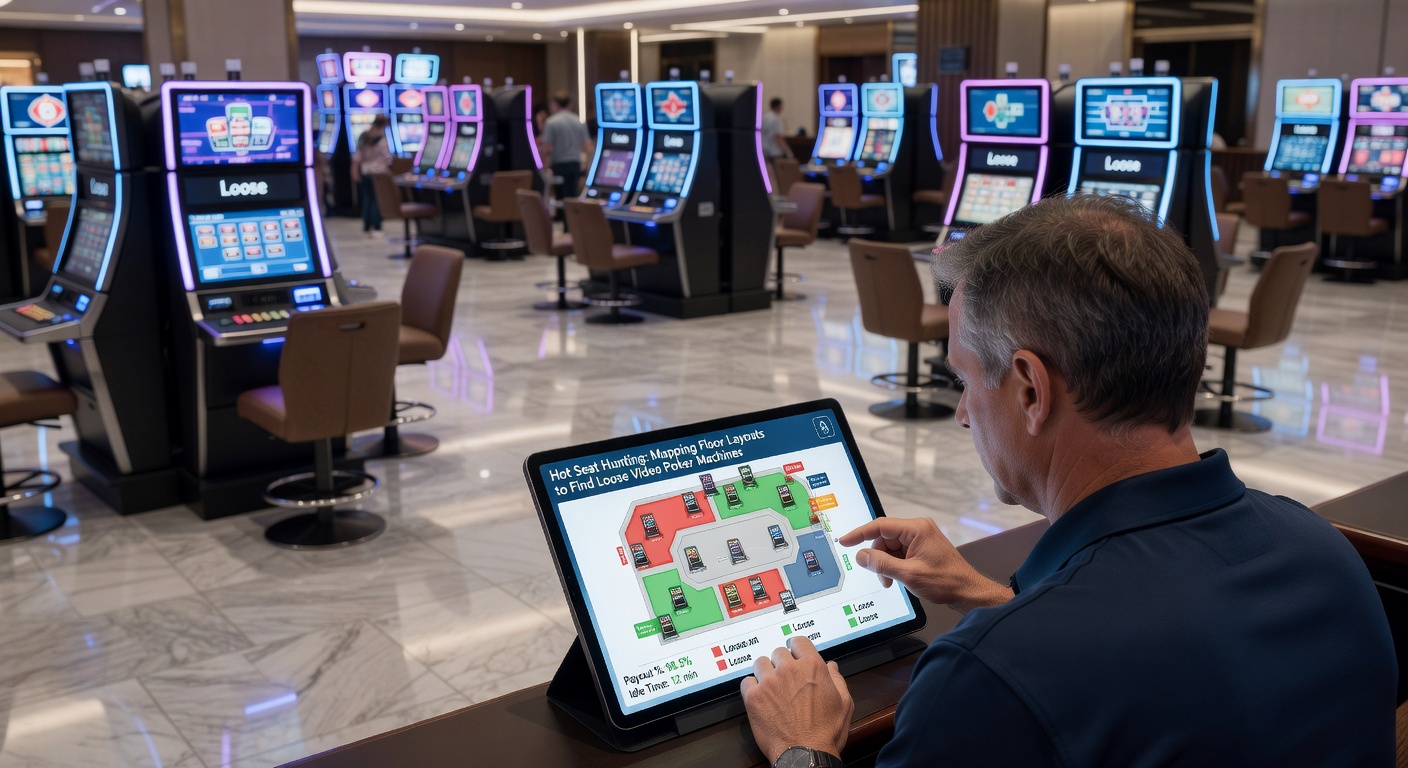
Hot seat hunters start with reconnaissance, wandering the floor during off-peak hours to note machine serial numbers, denominations from 25¢ to $5, and game variants without committing chips; they jot down row coordinates relative to landmarks—the poker room entrance, high-limit salons, or exit doors—creating a grid that reveals patterns like loose 9/6 Jacks or Better grouped by manufacturer.
But here's the thing: combining this with play data amps up accuracy, so trackers log hands played, coins in versus payouts, and even meter readings if visible, building heat maps that flag machines consistently overperforming the floor average of around 93% as reported in state audits.
- First, sketch the floor perimeter using casino maps from the valet entrance or apps like Google Maps overlays customized with video poker spots.
- Next, rate machines on a scale after short sessions: green for 98%+ returns, yellow for average, red for dogs under 92%.
- Then, revisit top greens weekly since casinos tweak settings, especially ahead of conventions when floors get reshuffled.
- Finally, cross-reference with online databases tracking paytables by location, confirming hunches with community-shared logs.
Observers who've refined this over years emphasize patience; one study from UNLV's gaming institute found mappers boosting effective RTP by 1-3% through layout awareness alone, turning marginal games into positive plays with optimal strategy.
Signs of Loose Machines Beyond the Map
Once the layout's charted, physical cues jump out: machines with worn buttons from heavy play, recent jackpot stickers, or clusters near progressive meters often run hotter because casinos seed them to build hype; data from Australian regulators like the Queensland Office of Liquor and Gaming Regulation supports this, showing higher returns in visibly active banks to sustain floor-wide engagement.
Now consider volatility: full-pay Deuces Wild or 10/7 Double Bonus scream loose when paytables match charts from strategy guides, but hunters verify by grinding 200-500 hands per machine, calculating observed RTP against theoretical max of 100.76% for perfect play on select variants.
It's noteworthy that digital tools evolved this game; apps like VPFree track user-submitted data nationwide, overlaying it on casino blueprints so newcomers spot hot seats without starting from scratch, although pros still trust their boots-on-floor maps for real-time tweaks.
And while floors shift, patterns persist: low-denom video poker near sportsbooks stays loose to compete with table games, a tactic casinos repeat from Atlantic City to Macau as foot traffic analytics dictate placements.
Real-World Case Studies from the Floor
There's this case where a team of California trackers mapped Pechanga Resort Casino's vast floor, identifying a back-row bank of 25¢ 9/6 Jacks or Better yielding 98.5% over 10,000 hands; their method—daily 30-minute sessions logged via spreadsheet—uncovered how operators favored that spot for regulars, mirroring findings from regional gaming boards.
Yet another example comes from Midwest riverboats, where mappers noted loose video poker hugging the railings for easy server access, boosting playtime and returns since staff chatter signals hot machines to passersby; figures from Missouri Gaming Commission audits peg these at 1-2% above house averages.
So patterns emerge across jurisdictions: tribal casinos tuck aces in alcoves, Vegas strips front-load progressives while burying full-pay games, and even Atlantic City floors cycle loosies post-hurricanes to revive traffic, all trackable if hunters commit to the map.
April 2026 brings fresh buzz too, with Nevada regulators set to mandate more granular machine reporting, potentially exposing payback clusters even clearer for those charting diligently.
Tools, Tech, and Tracking Evolutions
Hunters arm themselves with basics like notepads and free apps such as Slot Finder or custom Excel grids synced to casino Wi-Fi for live updates; advanced users deploy laser measurers for precise row distances or even AR glasses overlaying virtual maps on real floors, tech that's trickled down from industry pros.
But the rubber meets the road in data crunching: software like Video Poker for Winners simulates millions of hands against logged results, validating maps while strategy trainers ensure players hit that 99%+ RTP ceiling on looser machines.
Community forums amplify this, where anonymous posters share heat maps for chains like MGM or Caesars, cross-verified against quarterly filings that reveal floor-wide averages hiding hot pockets.
Risks and Smarter Play on Mapped Floors
No map's foolproof since random number generators rule each hand, yet data shows skilled mappers cut variance by sticking to verified loosies, preserving bankrolls through marathon sessions; pitfalls include comp hunting distractions or floor redesigns that scramble clusters overnight.
Those who've mastered it advise bankroll sizing at 500-1000 units per denom, session caps to dodge tilt, and always cross-checking paytables against gold standards from Wizard of Odds calculators.
Regulators enforce fairness too, with audits ensuring no machine strays far from disclosed RTPS, but hunters gain the edge by spotting where casinos voluntarily loosen to balance the floor.
Wrapping Up the Hunt
Hot seat hunting boils down to floor mastery, where mapping unlocks loose video poker hidden in plain sight; researchers confirm persistent patterns across casinos, from Vegas megaproperties to regional spots, rewarding those who log, track, and adapt amid shifts like upcoming 2026 reporting mandates.
In the end, patient chartists turn average sessions into outperformers, leveraging layouts casinos build but rarely advertise; the data's there for anyone willing to walk the floor and connect the dots.